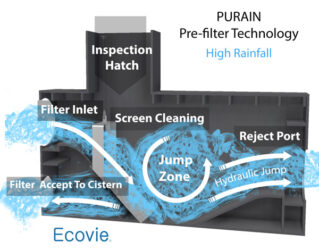
In another post, we showed how to size a PURAIN self-cleaning Jump Filter. In this post, we show that once you have selected a filter, how to estimate the expected capture efficiency.

As a reference, please check out our first post on sizing PURAIN filters. Here is a summary:
- Look up the 5-minute intensity, 1-year interval rainfall for your installation site on the NOAA website. Using this number to calculate flow off the roof.
- Compare this flow to the maximum allowable flow for each filter and choose the smallest filter that will handle this flow.
OR!
Download this handy sizing chart! It shows recommended sizing for a wide number of US cities using the method above.
The message is that it is not possible to give a blanket square footage rating for a filter because rainfall intensity varies so widely throughout the US and throughout the world. Many other filter manufacturers erroneously give roof square footage ratings based on intensity rainfall rates in Germany! There are places in the US and elsewhere in which these guidelines work, but there are many more that do not.
Once you have selected a PURAIN filter, you can estimate how much water it will collect. To do this, I take a 9,000 square foot small commercial roof and place it in 3 separate locations, Boston, Miami, and San Francisco.
Based on 1 year, 5-minute intensities, the following PURAIN filters are recommended:
Boston
PURAIN DN 200, 8″ Inlet Filter
San Francisco
PURAIN DN150-S, 6″ Inlet Filter
Miami
PURAIN DN300, 12″ Inlet Filter
There you have it, different filter sizes are recommended in different locations even though the roof sizes are exactly the same. It tends to rain harder in Miami than in Boston and harder in Boston than in San Francisco. This means you need a different sized filter for each location. So, how does each filter perform?
To figure this out, we use actual 5 minute rainfall data over the course of a year. I chose near average years for each city which turned out to be 2014 for Boston and Miami and 2015 for San Francisco. There are actually over 106,000 data points in a single year so the spreadsheet gets a little cumbersome. Nevertheless, there “only” a few thousand five minute periods in any of these 3 locations in which it actually rained, so that cuts it down a bit. If flow rate in any 5 minute period exceeds what the filter screen can accept, then a portion is rejected in a hydraulic jump. We simply add up all the water that is captured and all the water is rejected to figure out capture efficiency. The website used for this is in this link if anyone wants to check it out. there is data from all over the US. A nice guy at NOAA showed me how to extract the data. http://www1.ncdc.noaa.gov
Purain Capture Efficiency, Based on Roof Size 9000 sq.ft
| City | Boston | Miami | San Fransisco |
|---|---|---|---|
| Purain Filter Size | DN150 | DN400 | DN100 |
| Inlet Size Inches | 6″ | 16″ | 4″ |
| Accept Flow Rate GPM | 96 | 400 | 21 |
| Annual Rainfall Inches | 42 | 53 | 24 |
| Annual Rainfall 100% Captured | 89% | 97% | 50% |
| Gallons Captured | 270,084 | 294,752 | 104,039 |
| Gallons Lost | 10,972 | 1,029 | 31,810 |
| Number of Hydraulic Jumps | 18 | 3 | 46 |
| CAPTURE EFFICIENCY | 96.1% | 99.7% | 76,6% |
Observations:
- Capture efficiency is very good for all 3 locations.
- There are a decent number of hydraulic jumps for all locations. Miami, especially, has a lot of filter cleaning with 24 hydraulic jump events.
- More water is captured in Boston than in Miami even though it rained less there. This is due to the high intensity rains in Miami. Indeed, around 75% of the rain in Boston in 2014 was at a rainfall rate of 0.5″ per hour or less versus only 28% for Miami.
The results raise a few questions:
- What if smaller filters were used in Boston and San Francisco?
- What if a bigger filter were used in Miami
Inquiring minds want to know, so here are the results:
Purain Capture Efficiency, Based on Roof Size based on 9,000 sq.ft
| City | Boston | Miami | San Fransisco |
|---|---|---|---|
| Purain Filter Size | DN200 | DN300 | DN150 |
| Inlet Size Inches | 8″ | 12″ | 6″ |
| Accept Flow Rate GPM | 175 | 240 | 96 |
| Annual Rainfall Inches | 42 | 52 | 24 |
| Annual Rainfall 100% Captured | 95% | 64% | 92% |
| Gallons Captured | 279,859 | 278,886 | 134,213 |
| Gallons Lost | 1,198 | 16,894 | 1,635 |
| Number of Hydraulic Jumps | 5 | 24 | 5 |
| CAPTURE EFFICIENCY | 99.6% | 94.3% | 98.8% |
Observations:
- Not much capturee efficiency is lost in Boston, so downsizing may be OK. However, overall hydraulic load on the filter will be exceeded more frequently so an emergency bypass would be required.
- In Miami, the bigger filtercaptures a little more water but the number of hydraulic jumps decreases a lot so the filter may not stay as clean. The added cost of the bigger filter may not be warranted.
- In San Francisco, capture efficiency drops a lot and the 4″ filter is too small. Plus overall maximum flow would be exceeded too often
Conclusions:
- The approach of using 1 year, 5 minute interval data as a sizing guide works well for the cities investigated. we have found this approach to work well in many other geographies as well.
- Capture efficiency is good for the filters selected using this method and trying other sizes probably would give worse results.


